Analysis of Precinct Return Data for Duval County, Florida
Prologue
Democrats Rue Ballot Foul-Up in a 2nd County
New York Times, 2000/11/17
The percentage of invalidated votes here was far higher than
that recorded in Palm Beach County, which has become the focus of
national attention and where Democrats have argued that so many
people were disenfranchised it may be necessary to let them vote
again. Neither Democrats nor Republicans have demanded a hand
recount or new election in Duval County.
Local election
officials attributed the outcome to a ballot that had the name of
presidential candidates on two pages, which they said many voters
found confusing. Many voters, they said, voted once on each page.
The election officials said they would not use such a ballot in
the future.
Rodney G. Gregory, a lawyer for the Democrats
in Duval County, said the party shared the blame for the confusion.
Mr. Gregory said Democratic Party workers instructed voters, many
persuaded to go to the polls for the first time, to cast ballots
in every race and "be sure to punch a hole on every page."
"The get-out-the vote folks messed it up," Mr. Gregory said
ruefully.
If Mr. Gregory's assessment is correct, and
thousands of Gore supporters were inadvertently misled into
invalidating their ballots, this county alone would have been
enough to give Mr. Gore the electoral votes of Florida, and thus
the White House.
|
Introduction
The New York Times article of November 17 presents an explanation for the
anomolous number of invalidated votes for president in Duval County.
The explanation is that Democratic Party "Get Out The Vote" (GOTV) workers
instructed voters
to "be sure to punch a hole on every page", which resulted in many
voters voting twice for president, once on each of two pages listing
presidential candidates.
If this hypothesis is correct, the behavior of Democratic voters would
result in these additional patterns in the voting data for Duval County:
- Precincts with disproportionately high rates of "double
punched" presidential ballots would have higher rates of "punch every page"
voters, and would therefore show a disproportionately lower rate of
"unvoted" ballots for less important races, such as Commissioner of Education.
- The rate of invalid presidential votes would be higher in precincts
with more Democratic voters, but the rate of invalid votes in other races
would remain approximately the same (or lower) compared to predominantly
Republican precincts.
- The rate of invalid votes in non-presidential races would be similar
to (or lower than) other comparable Florida counties.
This document analyzes Duval County precinct data to evaluate the validity
of the "punch every page" hypothesis.
The raw precinct return data for Duval County, Florida, for the general
election of November 7, is available from the web page of the
Duval County
Commisioner of Elections. This data is in a format which is not
spreadsheet friendly.
The data has been reformatted into a standard CSV format file for this
analysis (which you can download here).
Methodology
The first step of the analysis is to sort each Duval County precinct
according to the percentage of Democratic voters in
the November 7th general election (see "What
is a Democrat?" sidebar). The precincts are placed in order, with
"least Democratic" precinct first, and "most Democratic" precinct last.
The next step is to determine the percentage of missing votes for each
precinct, for each of four races: U.S. President, U.S. Senator, Florida
Treasurer/Insurance Commissioner, and Florida Commissioner of Education.
"Missing" votes are determined by taking the sum of all votes cast for all
candidates in a given race in a given precinct, and subtracting that figure
from the total
ballots cast in that precinct.
A "missing" vote can be the result of an undervote
(failure of a valid selection to be read by the vote counting machine), of
an overvote (an invalid selection of more than one candidate in a single
race), or of an abstention (a deliberate omission of a vote for a
candidate).
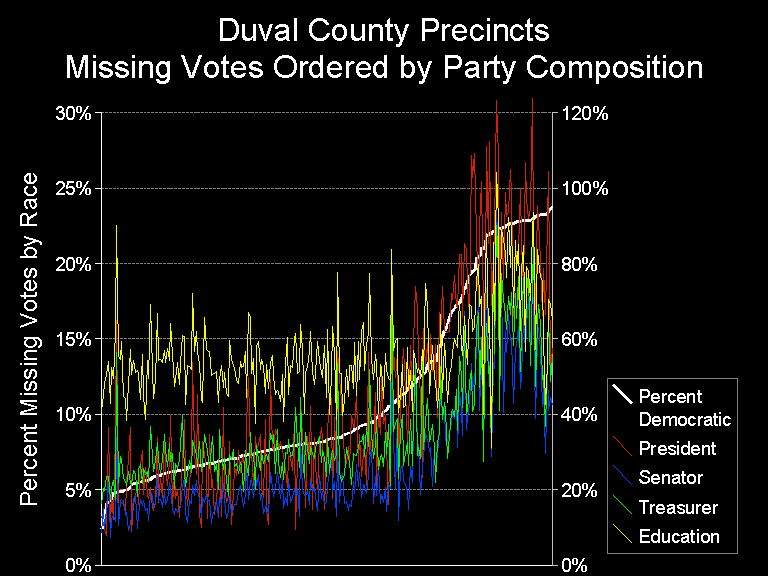
The resulting data can be plotted on a graph, as seen in
figure 1.. Because of the "noisy" character of the
data, and the relatively large number of different data sets being plotted
on the same chart, it is difficult to visualize trends in this figure.
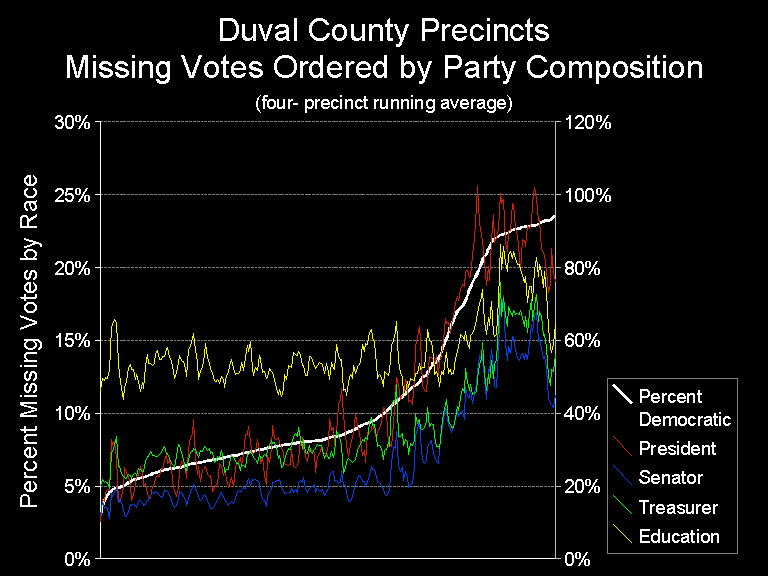
To facilitate visualization, a second data set is derived from the first
set by taking a running four-unit average. The first element is computed
as the average of the first, second, third, and fourth elements of the
original set. The second element is computed as the second, third, fourth,
and fifth elements of the original set, and so on. This running average
technique has the effect of "smoothing out" local random variations in the
data, so larger trends are more apparent.
The resulting data plot is seen in figure 2.
This organization of the data illustrates three types of information
simultaneously:
- The relative distribution of precincts countywide by different party
composition:
strongly Republican, Republican leaning, Democratic leaning, and strongly
Democratic.
- The absolute percentage and relative ranking of missing votes in the
presidential, senatorial, treasurer, and education races.
- The correlation between precinct party composition and missing vote
percentages and rankings.
Figure 1 Explanation
|
This is a split scale graph. The scale on the left, from 0% to 30%, applies
to the percentage of missing votes in the four races. The four races
themselves are indicated by the four colored lines: red for the presidential
race, blue for the senatorial race, green for the treasurer race, and yellow
for the education race.
The scale on the right, from 0% to 120%, applies to the percentage of
Democratic voters. The Democratic voter percentage is indicated by the
thick white line. This line is reduced in vertical scale by a 4:1 ratio
relative to the colored "missing vote" percentage lines.
The 268 Duval County precincts are sorted from left to right in order of
increasing Democratic party composition.
|

|
Figure 2 Explanation
|
This is a split scale graph. The scale on the left, from 0% to 30%, applies
to the percentage of missing votes in the four races. The four races
themselves are indicated by the four colored lines: red for the presidential
race, blue for the senatorial race, green for the treasurer race, and yellow
for the education race.
The scale on the right, from 0% to 120%, applies to the percentage of
Democratic voters. The Democratic voter percentage is indicated by the
thick white line. This line is reduced in vertical scale by a 4:1 ratio
relative to the colored "missing vote" percentage lines.
This graph is a "running average" data plot.
Each position on the X axis of this graph represents an average of four
adjacent sorted precincts, for all races and for party composition.
The leftmost position represents the average of the first, second, third,
and fourth precincts in figure 1.
The second position on this graph represents the average of the second, third,
fourth, and fifth position, and so on.
This graph presents the same data as figure 1, but with local random variations
smoothed out.
|

|
Analysis
One of most immediately striking features of this data is the nearly perfect
fit between the Percent Democratic curve and the missing presidential votes
curve. Not only is this fit unexpected in itself, but there is also the fact
that the scaling factor is an exact integral value, 4:1.
Any explanation for the anomolous invalidation of presidential votes in Duval
County must account for this circumstance.
To account for this under the "punch every page" hypothesis, one would
have to assume that the Democrats were almost entirely responsible for
the missing presidential votes. In other words, one would posit
that Republican voters had extremely low rates of invalidated presidential
votes, and that approximately one out of every five Democrats--uniformly
throughout
Duval county--invalidated their presidential vote as they dutifully punched
their way, page by page, from the front of the ballot to the back
By itself, this proposition may not be entirely plausible, but when
viewed in light of other data, it is even less so.
For Republican precincts (those with less than 50% Democratic voters), the
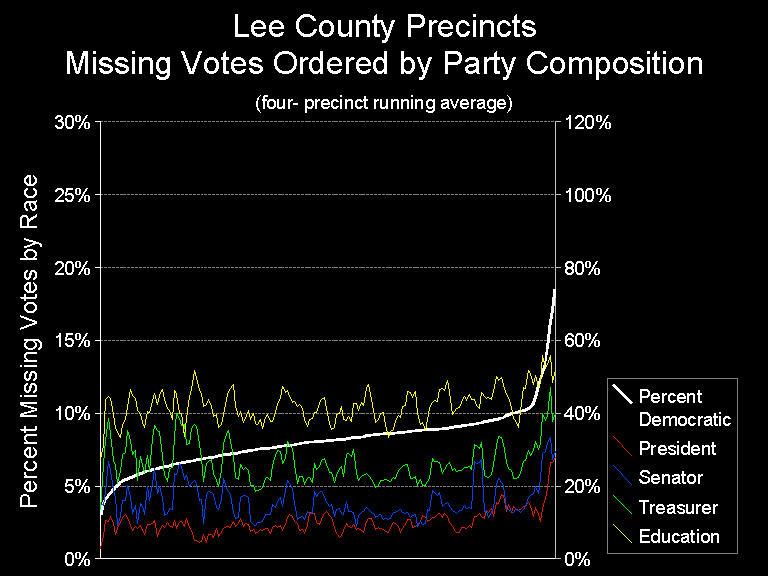
plot of missing Commissioner of Education votes is unexceptional. It is
only a few percent greater than the comparable data for Lee County
(figure 3). The overwhelming majority of these
missing votes are almost certainly "abstentions": votes not cast for a race
few care about. However, the rate of missing education votes does not
increase or decrease as Democratic participation rises from 10% to 50%.
This suggests that Democratic voters in the Republican precincts were
punching or not punching selections for Commissioner of Education at
approximately the same rate as Republican voters.
However, in the same range, the percentage of missing presidential votes
rises in direct proportion to the percentage of Democratic voters,
ostensibly due to the influence of "every page" voters. One might argue that
the Republican voting population has the same proportion of "every page"
voters as the Democratic population, but that the Republican "every page"
voters never mistakenly double-punch the presidential race. This argument,
however, does not withstand the evidence of the Democratic precincts, where
the percentage of missing education votes increases significantly in
proportion to the increase in Democratic composition.
The increase of missing education votes in Democratic precincts indicates
that the "every page" voting behavior of Democratic voters in Republican
precincts differs from that of Democratic voters in Democratic counties.
Yet the increase of missing presidential vote indicates that Democrats have
the same "every page" voting behavior regardless of precinct party composition.
The "every page" hypothesis only provides an explanation for how
presidential votes could go missing. One would expect, in consequence,
that the missing vote rate for non-presidential races in Duval County would
be similar to comparable counties. However, by comparing these races with
the plots in figure 3, one notices that Duval County
missing vote rates in the senatorial, and treasurer races also show an
anomolous trend upward with increased Democratic participation, albeit not
to the same extent as the presidential race.
Figure 3 Explanation

|
Conclusion
The "be sure to punch a hole on every page" hypothesis purports to explain
the large number of invalid presidential votes found in Duval County.
However, this hypothesis does not explain how the missing votes in the
presidential race are proportionate regardless of precinct party composition,
where the education race shows significant variation depending on party
balance. The hypothesis also does not explain the very large number of
missing votes for the senatorial and treasurer races found in Democratic
precincts in Duval County, but not other counties.
Approximately 20,000 presidential votes have gone missing in Duval County
(above and beyond what would normally be expected). So far there is not
a hypothesis that successfully explains why that is also consistent with all
the data.
What is a Democrat?
There are many ways to define a Democrat (or Republican, for that matter),
but most are too ambiguous for the purposes of a statistical analysis.
A voter can be a registered member of the Democratic Party, but vote for
Republicans more often than not. Another voter may not have a party
affiliation, but vote straight Democratic tickets election after election.
Which is the Democrat?
For the purposes of this analysis, a Democrat is someone who, all else being
equal, will vote for a Democratic candidate over a Republican candidate. This
definition, though, then raises the question of how to determine "all else
being equal".
Generally speaking, the less a voter knows about contending candidates, the
more "all else is equal". A cross-correlation analysis of all the races in the
Duval County general election bears this out. The minor races for Treasurer
and Commissioner of Education are the most partisan of all the countywide
races. That is to say, Democratic and Republican votes in these races are most
strongly correlated with votes for Democratic and Republican candidates in other
races. Also, Republican votes in the Treasurer race have the least correlation
with Democratic votes in the Education race (and vice versa, both ways).
|
Treasurer |
Education |
|
Gallagher |
Cosgrove |
Crist |
Sheldon |
| Bush |
0.997 |
0.036 |
0.998 |
0.080 |
| Gore |
0.244 |
0.979 |
0.215 |
0.985 |
| McCollum |
0.998 |
0.046 |
0.998 |
0.089 |
| Nelson |
0.295 |
0.972 |
0.265 |
0.981 |
| Gallagher |
1.000 |
0.084 |
0.999 |
0.128 |
| Cosgrove |
0.084 |
1.000 |
0.054 |
0.997 |
| Crist |
0.999 |
0.054 |
1.000 |
0.097 |
| Sheldon |
0.128 |
0.997 |
0.097 |
1.000 |
Correlation Coefficients of Candidate Votes In Duval County
The definition of "Percent Democratic" used in this analysis is based on
an interpolation between percentage of votes cast for Treasurer that were
for Cosgrove, and the percentage of votes cast for Commissioner of Education
that were for Sheldon. The formula is as follows:
Percent Democratic = (Cosgrove + Sheldon) / (Gallagher + Cosgrove + Crist + Sheldon)
|
Send Comments


